Max: Hey Zoe, I’ve been hearing a lot about Dataverse telemetry and Application Insights. Can you explain what it is and how it helps with logging and diagnostics?
Zoe: Sure, Max! Application Insights, a feature of Azure Monitor, is used for monitoring and diagnostics within the enterprise landscape. It captures telemetry data from your Dataverse environment and pushes it to your Application Insights environment. This data is stored in Azure Monitor logs and visualized in various panels for performance and failures.
Max: That sounds useful. What are the benefits of using Application Insights for Dataverse telemetry?
Zoe: There are several benefits:
- No Coding Required: You can enable telemetry without writing any code.
- Proactive Monitoring: Use Smart Detection to monitor performance trends and set up alerts for important scenarios.
- User Insights: Visualize navigation patterns to optimize user experience, like rearranging fields based on common user actions.
- Detailed Diagnostics: Create custom queries to troubleshoot performance and errors, and use the Performance and Failures panels for detailed insights.
Max: How do I set it up?
Zoe: It’s simple. An admin provides the Application Insights instrumentation key during setup in the Power Platform admin center. Once setup is complete, telemetry data is sent to your Application Insights environment. You can also opt-out anytime by deleting the data export connection.
Max: What specific features does Application Insights offer?
Zoe: Here are some key features:
- Dashboards: Create dashboards to get an overview of your organization’s health.
- Alerts: Set up alerts for key metrics to stay proactive.
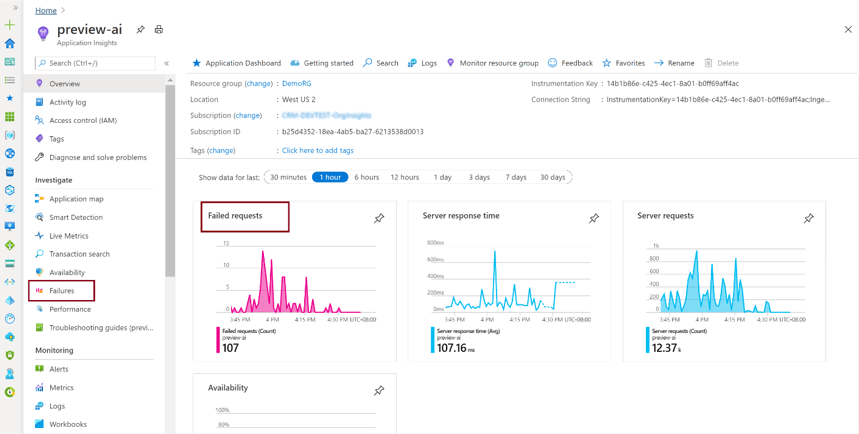
- Performance Panel: Diagnose potential problems by analyzing operations with the longest duration.
- Failures Panel: Identify and troubleshoot failed requests, with details on the operations and users affected.
Max: Can you explain more about the Performance and Failures panels?
Zoe: Sure. The Performance Panel shows the count and average duration of each operation. It helps identify operations that most affect users. The Failures Panel shows the count of failed requests and the number of users affected. It provides details on error types and dependencies, helping you diagnose the issues.

Max: What about custom telemetry? Can I add my own metrics?
Zoe: Absolutely. If the standard telemetry doesn’t cover everything you need, you can write custom telemetry. For server-side logic, use the Microsoft.Xrm.Sdk.PluginTelemetry.ILogger interface in your plug-in code. For client-side JavaScript, use existing patterns to write to Application Insights.
Max: What types of telemetry are included and what’s not?
Zoe: For model-driven apps, telemetry includes events like edit form, grid, and dashboard load events. However, save events and ribbon commands aren’t included. For Dataverse, you see server requests and their processing details but not detailed database information or physical server resource usage.
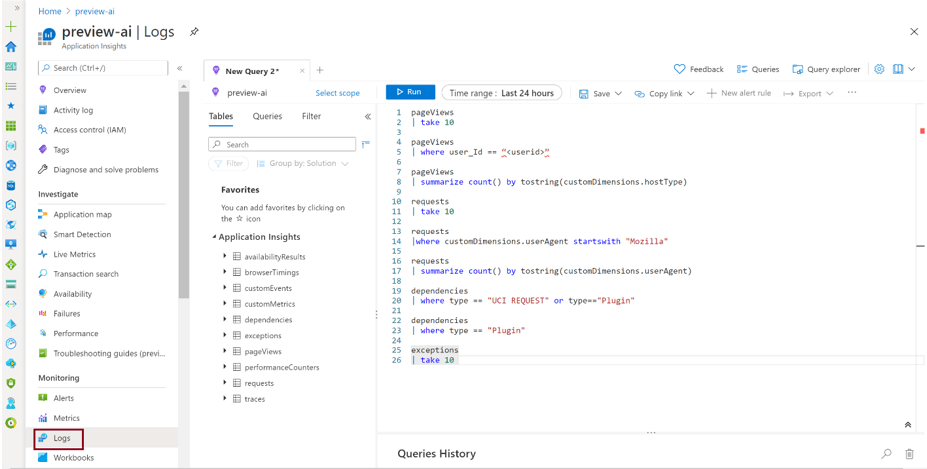
Max: How can I query this data?
Zoe: You can query the data using the Logs panel under Monitoring in Application Insights. Common fields include cloud_RoleInstance, operation_Id, session_Id, and user_Id. You can write queries in Kusto Query Language (KQL) to analyze the telemetry data.
Max: This sounds incredibly useful. Thanks for the detailed explanation, Zoe!
Zoe: Anytime, Max! It’s a powerful tool that will definitely help you keep your applications running smoothly and efficiently. If you have any more questions, feel free to ask!
