Max: Hey Zoe, I’ve been working with Dataverse and heard about tracking API incoming calls and plugin execution logs. Can you explain how this works and how I can query this information?
Zoe: Sure, Max! Dataverse provides detailed performance data for API incoming calls, plugin execution logs, and SDK operations. This data is sent to Application Insights where you can query and analyze it.
Max: That sounds helpful. Let’s start with API incoming calls. How do I query these in Application Insights?
Zoe: API incoming calls can be found in the requests table. Here’s a basic query to summarize user agent counts:
requests
| summarize count() by tostring(customDimensions.userAgent)
Max: What about plugin execution logs?
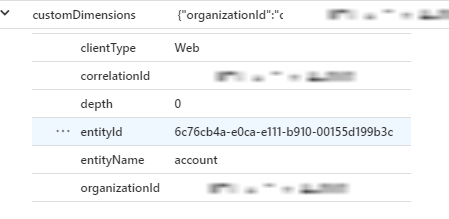
Zoe: Plugin execution logs are found in the dependencies table. Here’s an example query to retrieve plugin logs:
dependencies
| where type == "Plugin"
| take 100
This will give you details like the plugin name, duration, and other custom dimensions.

Max: And for SDK operations?
Zoe: SDK operation logs are also in the dependencies table. Here’s a sample query to retrieve SDK logs:
dependencies
| where type startswith "SDK"
| take 10
This will show you the type of SDK request, the entity targeted, and other relevant details.
Max: What if I need to find exceptions?
Zoe: Exceptions are captured in the exceptions table. Here’s a query to retrieve exception details:
exceptions
| take 10

You can also filter by user ID if you’re tracking a specific user’s errors:
exceptions
| where user_Id == '12345678-68cd-4e73-908f-126342b36315'
Max: How do I know if a plugin update caused performance issues?
Zoe: You can query the average duration of a specific plugin over time. Here’s an example:
dependencies
| where ['type'] == "Plugin"
| where name startswith "[InsertYourPluginName]"
| summarize avg(duration) by name
Max: Can I see how the API was performing before a reported issue?
Zoe: Absolutely. Use this query to analyze API performance over time:
requests
| where url == "https://<URLHere>"
| summarize avg(duration), count() by bin(timestamp, 1h)
| render timechart
This shows performance trends and request counts over time.
Max: What about creating custom dashboards?
Zoe: Yes, you can build custom dashboards in Application Insights to monitor and visualize data based on your queries.
Max: Can I track plugin performance and failure rates during peak usage?
Zoe: Yes, here’s a query to understand plugin performance:
dependencies
| where ['type'] == "Plugin"
| where name == "[Plugin name here]"
| summarize avg(duration) by bin(timestamp, 1h)
| render timechart
Max: What about handling 429 errors?
Zoe: The 429 errors are tracked as well. Use this basic query to understand them:
requests
| where resultCode == "429"
Max: Can I track execution paths and see if a plugin is slowing down due to calls it makes?
Zoe: Yes, all messages and plugins executed for a request are logged. You can query these to analyze execution paths. For example, use the operation_ParentId to track specific requests:
union *
| where operation_ParentId contains <requestId>
Max: Thanks, Zoe! This really helps me understand how to use Application Insights for Dataverse.
Zoe: Anytime, Max! These tools are incredibly powerful for monitoring and troubleshooting your Dataverse environment. If you have any more questions, feel free to ask!
