Max: Hey Zoe, I want to set up Application Insights to monitor my Power Automate flows. Can you help me with the steps to monitor cloud flow executions, triggers, and actions?
Zoe: Sure, Max! Let’s break it down. First, it’s important to know that Power Automate telemetry data flows into two main tables in Application Insights: Requests and Dependencies.
Max: What’s the difference between these two tables?
Zoe: Good question. The Requests table contains data about cloud flow runs, while the Dependencies table contains data about cloud flow triggers and actions. This setup allows comprehensive monitoring of your flows.
Max: How do I start monitoring cloud flow executions?
Zoe: Follow these steps:
- Access Metrics: From the Application Insights dashboard for your instance, select Metrics from the left navigation menu and then select Server requests from the Metric filter. Adjust the time period filter as needed.
- Filter by Environment: To filter cloud flow executions to a specific environment, select Add filter, choose environmentId from the Property field, and select your environment.
- Filter by Flow: To monitor specific flows, add another filter. Select Add filter, choose Operation name from the Property field, and select the flow(s) you want to monitor. The Operation Name maps to the flow identifier you see in Power Automate.

Max: What if I need to monitor cloud flow triggers and actions?
Zoe: Here’s how you do that:
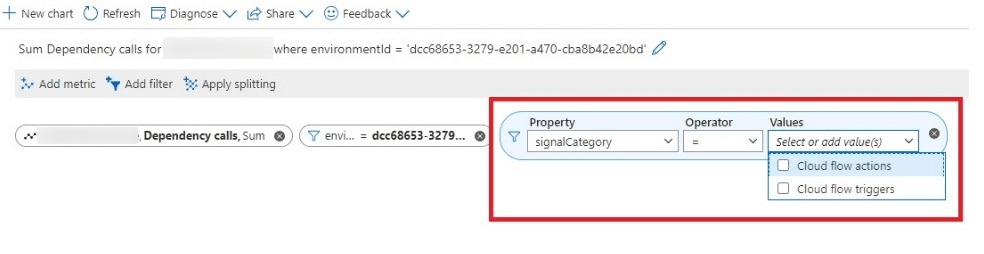
- Access Dependency Calls: From the Application Insights dashboard, select Metrics from the left navigation and then select Dependency calls from the Metric filter.
- Filter by Environment: Select Add filter and choose environmentId to filter for specific environments.
- Filter by Signal Category: Add another filter, choose Signal Category from the Property filter, and select Cloud flow triggers or Cloud flow actions depending on what you need to monitor.
- Filter by ResourceId: To filter for specific flows, select Add filter, choose ResourceId, and select the specific flow IDs. Within the Dependencies table, ResourceId maps to the flowId.
- Further Filter by Operation Name: If you want to specify names of specific actions or triggers, select Add filter and choose Operation Name from the property filter. These names are the same as the display names in Power Automate.
Max: Can I save these dashboards for quick access?
Zoe: Absolutely! You can pin these dashboards as favorites for quick reference. This way, you can easily access the metrics and insights you need regularly.
Max: What about any limitations or special notes?
Zoe: There are a few things to note:
- This feature is supported only for Managed Environments.
- Export of Power Automate data isn’t available in sovereign clouds like GCC, GCC High, and DoD.
- The telemetry logs are not 100% lossless. There might be small data losses due to temporary service issues. However, the flow execution history in Power Automate provides a full view of events.
Max: Thanks, Zoe! This really helps me understand how to set up and monitor my Power Automate flows with Application Insights.
Zoe: Anytime, Max! Setting up these monitoring capabilities will help you keep track of performance and quickly identify and resolve issues. If you have more questions, feel free to ask!
