
If you’re working with Microsoft Dataverse, you now have access to a new preview feature designed to enhance your ability to trace and debug plug-ins. Here’s a quick overview of this feature, its capabilities, and how you can make the most of it during your development process.
Why Use Tracing for Plug-Ins?
Tracing is an invaluable tool for both low-code and pro-code plug-ins, providing detailed runtime information that can help diagnose failures or validate certain states during development. This new plug-in monitoring feature in the Dataverse accelerator app builds on existing tracing and logging capabilities, offering a modern interface to streamline troubleshooting and debugging.
Prerequisites
Before diving into the plug-in monitoring feature, ensure you have the following:
- Security Role: You’ll need either the System Customizer or System Administrator role to enable logs and access the app. Alternatively, custom roles can be created with specific privileges.
- Read Logs: Requires organization-level read privileges to the Trace table.
- Enable Logging: Requires organization-level write privileges in the PluginTraceLogSetting of the Organization table.
Key Features
- Centralized Log Viewer: Access and view trace logs from various sources, including Dataverse custom APIs, low-code plug-ins, and pro-code plug-ins, all from a single location.
- Filtering Capabilities: Quickly find the logs you need by applying filters to narrow down results based on criteria like plug-in name, execution date, and duration.
Installation
To get started with plug-in monitoring, you’ll need to install the Dataverse accelerator app. Follow the installation instructions below.
- Open the Power Platform Admin Center in a new browser profile.
- Click on Environments.
- Choose the required environment.
- Click on Resources and select Dynamics 365 apps.
- Click on Open AppSource.
- Search for “Dataverse Accelerator” and click on it.
- Click on Get it now.
- Choose the environment, accept the terms and conditions, and click on Install.
- Wait for the installation to complete; the status will change to Installed.
- Open the Power Apps Maker Portal in a new tab and choose the required environment.
- Navigate to Solutions to see all solutions installed with the Dataverse Accelerator App.
- Click on Apps and select Dataverse Accelerator App.
- Click on Allow.
- Start using the Dataverse Accelerator App.
Trying Out the Plug-In Monitoring Feature
Access the Feature: Once installed, navigate to the Plug-in Monitoring feature in the Dataverse accelerator app.
Enable Log Capturing: If logging isn’t already enabled in your environment, you’ll be prompted to do so. You can choose to capture all logs or only exceptions, depending on your needs. Settings can be adjusted later via the command bar.

View Logs: After enabling logging, plug-in events will start appearing in the main list on the screen. If nothing shows up initially, try creating and running a new low-code plug-in to generate logs.
Filter Logs: Use the filter pane or the search bar to quickly locate specific logs based on various criteria such as plug-in name, invocation time, duration, and type (e.g., synchronous or asynchronous plug-ins, custom APIs).
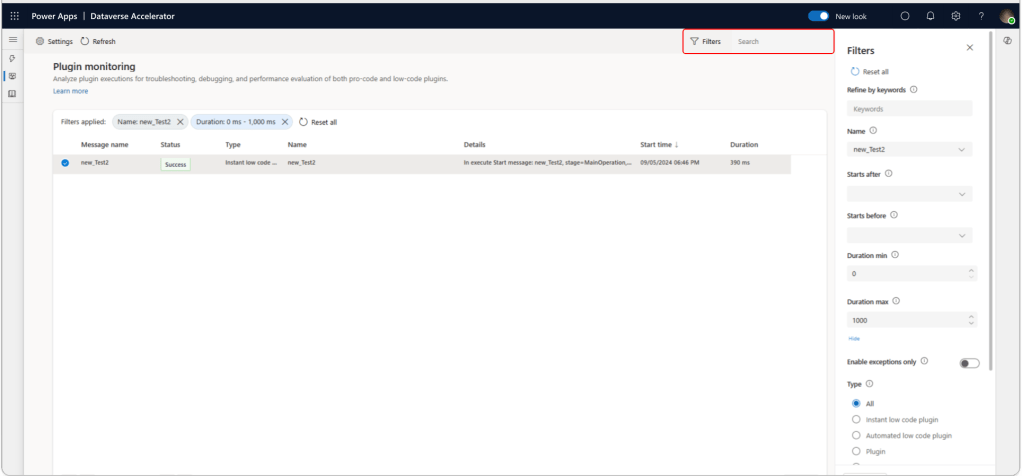
Read Log Details: Select any log entry to view detailed information, including execution status, output parameters, and error messages. The log details pane will show expanded sections for message blocks and exceptions when applicable.
Tips for Effective Monitoring
- Tracing for Development: While tracing and logging are perfect for debugging during development, consider using Azure App Insights for monitoring plug-in workflows in production environments.
This new preview feature is a powerful addition to the Dataverse toolkit, making it easier to manage and troubleshoot plug-ins during the development phase. As it’s still in preview, expect some changes and enhancements before the official release. Start using it today to streamline your development process and enhance your ability to diagnose issues quickly and efficiently.
Another honorable mention in the realm of efficient community plugins is the Plug-in Trace Viewer by Jonas Rapp (https://jonasr.app/ptv/). This plugin is a true savior for developers, offering an extensive array of features that greatly simplify the debugging of plugin traces. If you’re looking to streamline your troubleshooting process and save time, this tool is a must-have in your arsenal.
