
Managing large datasets can be overwhelming, especially when dealing with complex records and relationships. With the new Copilot-powered data visualization feature in model-driven apps, you can now generate AI-driven charts to uncover insights, detect trends, and enhance decision-making—all without leaving your grid view!
🚀 In this blog, we’ll explore how to enable and use this feature, personalize your visualizations, and leverage natural language search for smarter data exploration.
🔑 Prerequisites: What You Need to Get Started
Before using Copilot’s data visualization and natural language search, ensure the following:
✅ Enable Modern UI: This feature is available for model-driven apps with the modern refreshed look enabled.
✅ Admin Setup: Your Power Platform administrator must turn on the setting “Allow AI to generate charts to visualize the data in a view” in the Power Platform admin center.
✅ Licensing: If using Natural Language Grid Search, users must have a Dynamics 365 license or another Copilot license if using Power Apps.
🛑 Note: This is a preview feature, meaning it’s still under testing and subject to changes before the final release.
📌 How to Visualize Data in a View
Once enabled, the Visualize button will appear on the grid page of your model-driven app.
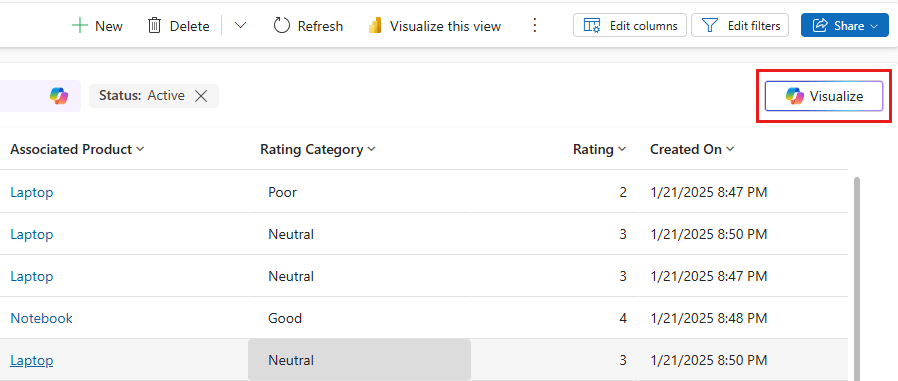
1️⃣ Navigate to a grid page (for example, Accounts, Cases, or Leads).
2️⃣ Click Visualize on the top menu.
3️⃣ Copilot generates an interactive chart based on visible columns and active filters.
4️⃣ Use Explain to view AI-generated insights explaining the visualization.
5️⃣ Hover over chart elements to examine data points and drill down further.


🖥 Example:
Imagine you manage a sales team and want to visualize revenue trends. By clicking Visualize, Copilot generates a clustered bar chart showing total revenue by industry, helping you pinpoint which sectors are driving growth.
🎨 Personalizing Your AI-Generated Charts
Once the visualization is generated, you can customize the chart in multiple ways:
📌 Chart Selector: Choose from 9 different chart types, including:
- 📊 Bar & Column Charts – Best for comparing categories.
- 📈 Line Charts – Ideal for showing trends over time.
- 🥧 Pie & Donut Charts – Useful for displaying proportions.
📌 Refresh Data: Click Refresh to update the visualization without changing the chart type.
📌 Expand View: Need a closer look? Click Expand to view the chart in full screen mode.
📌 Copy & Share: Click Copy to export the chart as a PNG image, making it easy to share in Teams, emails, or presentations.
📌 Drill Down on Data:
- Click on chart elements to filter the grid for specific values.
- Click again to remove the filter.
🗣 Introducing Natural Language Grid & View Search (Preview)
🔍 Ever wished you could just “ask” for the data you need?
With Natural Language Grid & View Search, you can now filter records using conversational queries instead of manual filters!
💡 Example Queries:
✅ “Show me cases with high priority and overdue follow-up dates.”
✅ “List all active opportunities over $50,000 closing this quarter.”
✅ “Display customer complaints resolved in the last 7 days.”
🎯 Key Benefits:
✔ Faster data retrieval – No need to manually set filters!
✔ Enhanced user experience – Use plain language to refine your grid view.
✔ More accurate search results – AI helps interpret your intent.
🚀 Pro Tip: The Natural Language Search feature is automatically turned ON for users who already have the Visualize data in a view feature enabled.
📊 How to Enable AI-Powered Data Visualization & Search
💼 For Power Platform Admins:
To enable these features, go to Power Platform Admin Center → Environment Settings → Feature Settings and turn on:
✅ “Allow AI to generate charts to visualize the data in a view”
✅ “Enable Natural Language Grid and View Search”
🤔 Why Use Copilot for Data Visualization?
🔹 Faster insights – Instantly transform raw data into visual trends.
🔹 Less manual effort – No need to manually build reports.
🔹 Interactive analysis – Click, filter, and explore data effortlessly.
🔹 AI-powered search – Ask questions in plain language and refine results easily.
🎯 Business Use Cases:
✔ Sales Managers can track revenue growth by industry or region.
✔ Support Teams can analyze customer complaints & resolution times.
✔ Finance Teams can visualize expenses & forecast trends.
🚀 Start using Copilot’s AI-powered data visualizations today and unlock deeper insights into your business!
