
Creating custom SSRS report is inevitable when there is a requirement to manipulate data that you can’t achieve it using report wizard or saved query. The custom report is very good old feature of the CRM that is will come to rescue.
Custom report development in On-Premise version of CRM have added benefits and challenges. The key benefits is to have the SQL data source. This will help in cover any complex reports that is needed for the implementation. The challenge is the setup and the installation of the server and it incompatible drivers in the browsers, that make SSRS in CRM a devil to deal with.
In the new era of Dynamics 365 the report requirements are either take care by Power BI or Data Analytics tools to achieve. For report with minimum complexity, SSRS and Fetch-XML are good fit. The challenge with Fetch-XML is the limitation of the grouping, or any complex functionalities that you can perform using SQL. In this case, you need to rely on the SSRS row/column grouping feature to achieve the desired result.
The requirement that we are going to discuss in this article in one such requirement where you need to group your ID column and transform the multiple row value to column value. This can be easily done in SQL query and consumed in SSRS tables. In the case of Fetch-XML your hands are tied, you are not able to add any additional row or pivot the rows to column. In this scenario, SSRS row/column grouping, expressions play a vital role.
Following is the data transformation that we need to achieve.

Lets assume that your got your Fetch-XML and the dataset are all ready. Importantly the development environment is ready, this is the trickiest of all. We are diving straight to tweak the SSRS row/column grouping to achieve this above end result.
Step 1: Add a table control and add the ID to the data row.
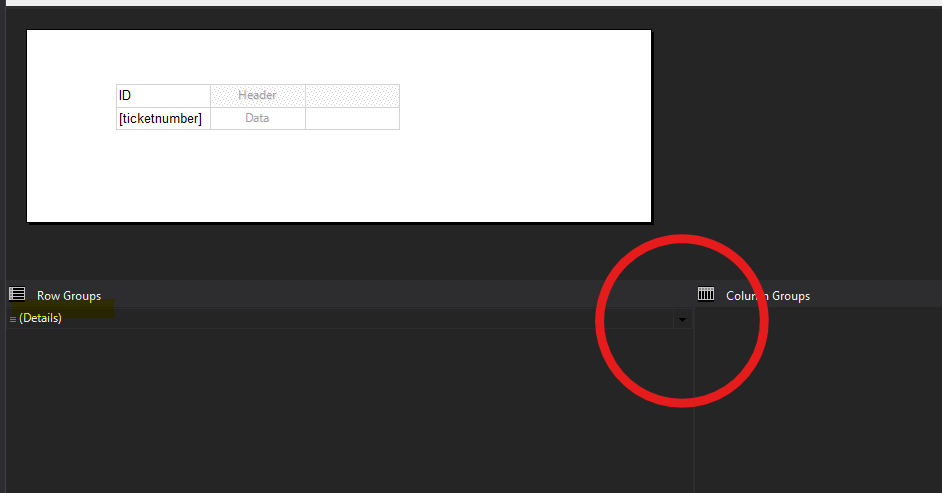
Step 2 : By default, there will be a row groups (Details) as below.
Step 3 : Add a parent row group by choosing Add Group -> Parent Group as shown below.

Step 4: Pick the ID column in the rows listed in the below screen and click OK.

Step 5: Now that you managed to group your row using the ID. The next steps are critical to transform your row values of items to each individual columns. Right click on the ID column choose Insert Column and select Right. A new empty column will be added to the right of ID column.
Step 6: In the header name it as “Item 1”, click on the data cell of the second column. Right click and choose “Expression” in the right click menu popped.
Step 7: Specify the below formula in the column expression. The below formula uses LookupSet to combine the row as comma separated value. Then use the split to get the individual values in an array. Used the GetValue(index) function to get the split array values.
IIf(Split(JOIN(LookupSet(Fields!ID.Value,Fields!ID.Value,Fields!ItemName.Value,"{DataSetName}"), ","), ",").Length > 0
,Split(JOIN(LookupSet(Fields!ID.Value,Fields!ID.Value,Fields!ItemName.Value,"{DataSetName}"), ","),",").GetValue(0)
)
,"")
Step 8: Repeat the same steps to get the next set of values too by changing the length size >1, >2, etc. For the column 2 onwards need to add additional condition to make the index dynamic. If it is not performed, you will get index out of bound array exception and the in the rendered report you will see #error.
IIf(Split(JOIN(LookupSet(Fields!ID.Value,Fields!ID.Value,Fields!ItemName.Value,"{DataSetName}"), ","), ",").Length > 1
,Split(JOIN(LookupSet(Fields!ID.Value,Fields!ID.Value,Fields!ItemName.Value,"{DataSetName}"), ","),",").GetValue(
IIf(JOIN(LookupSet(Fields!ID.Value,Fields!ID.Value,Fields!ItemName.Value,"{DataSetName}"), ",").Length > 1, 1, 0)
)
,"")
It always seems impossible until it’s done.!
Nelson Mandela
